Figures
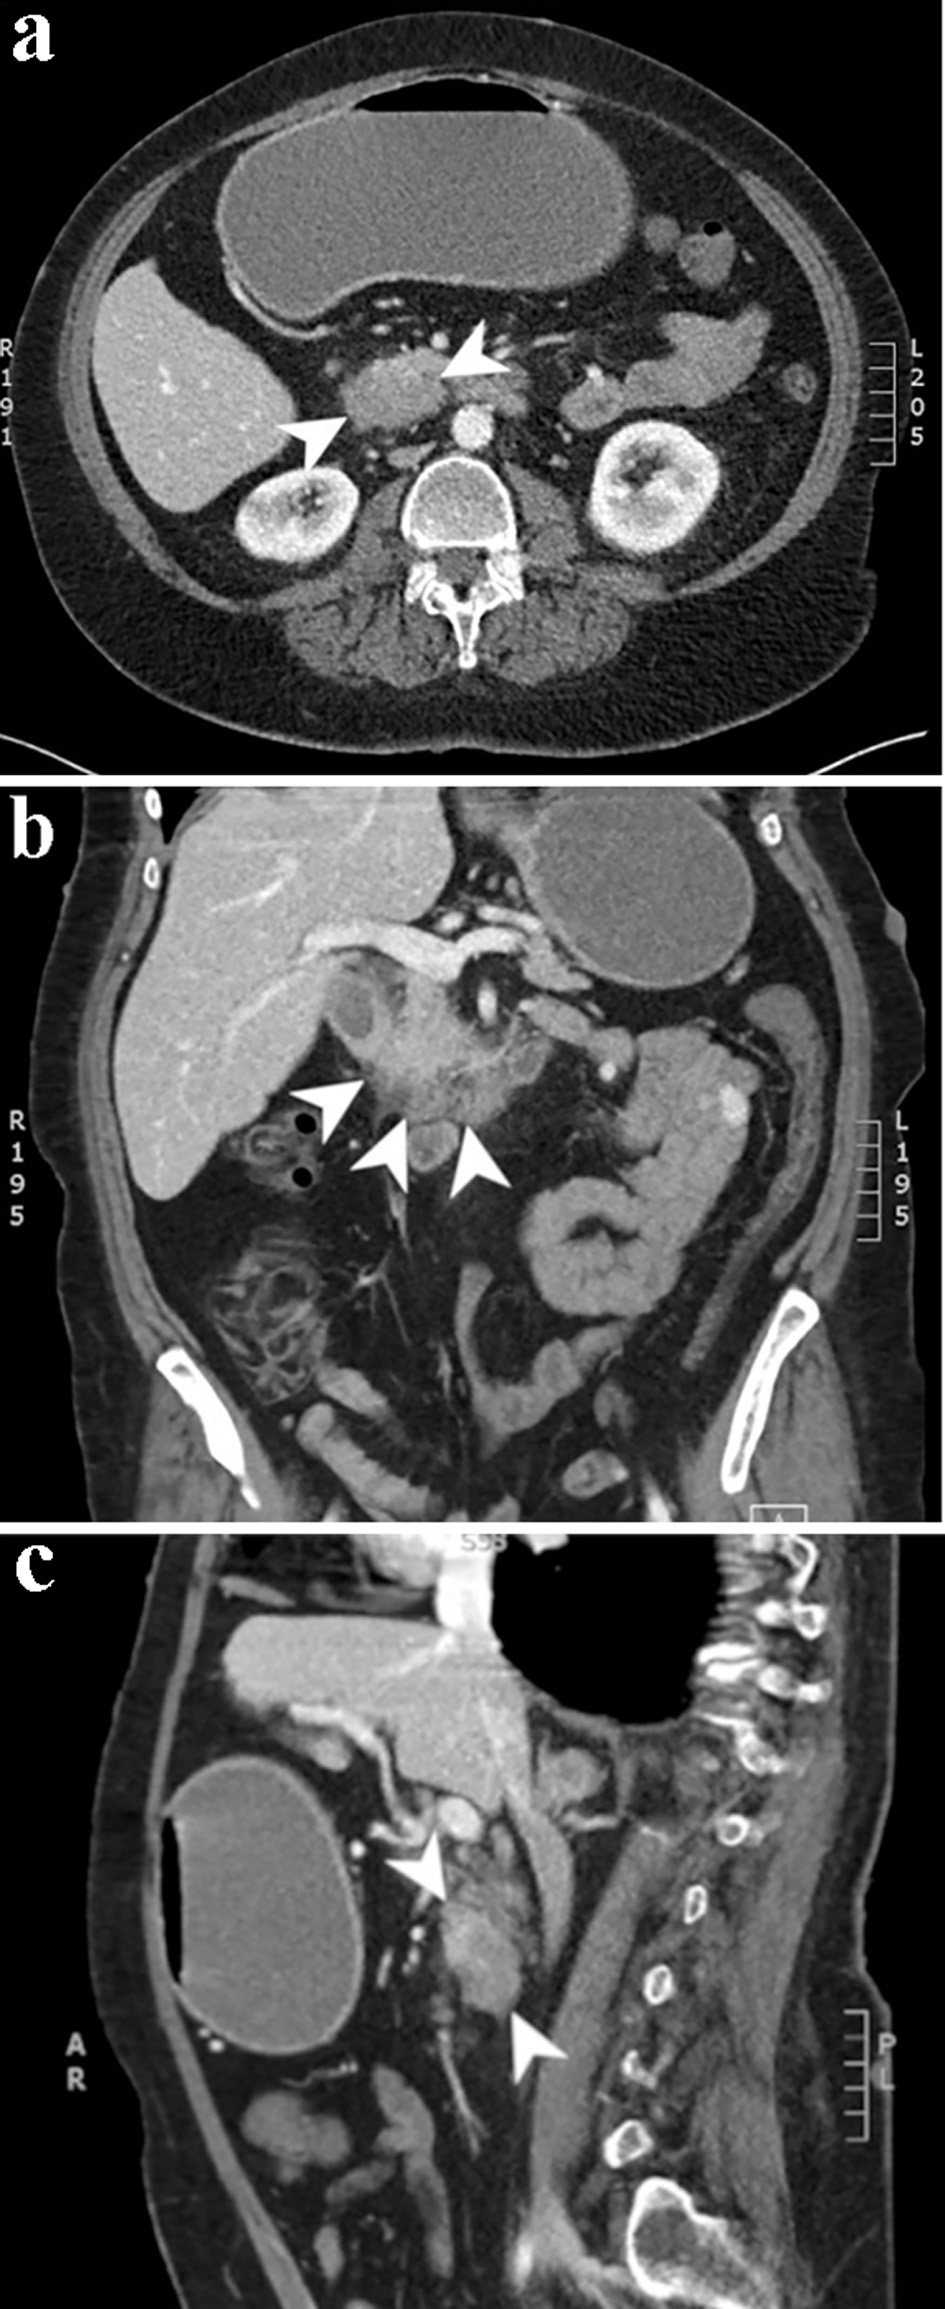
Figure 1. Computed tomography scan of the abdomen and pelvis with and without contrast. Axial (a), coronal (b), and sagittal (c) slices from the venous phase of a computed tomography scan demonstrating a 4.2 × 2.8 cm focus of duodenal wall thickening and soft tissue prominence concerning for a duodenal neoplasm.
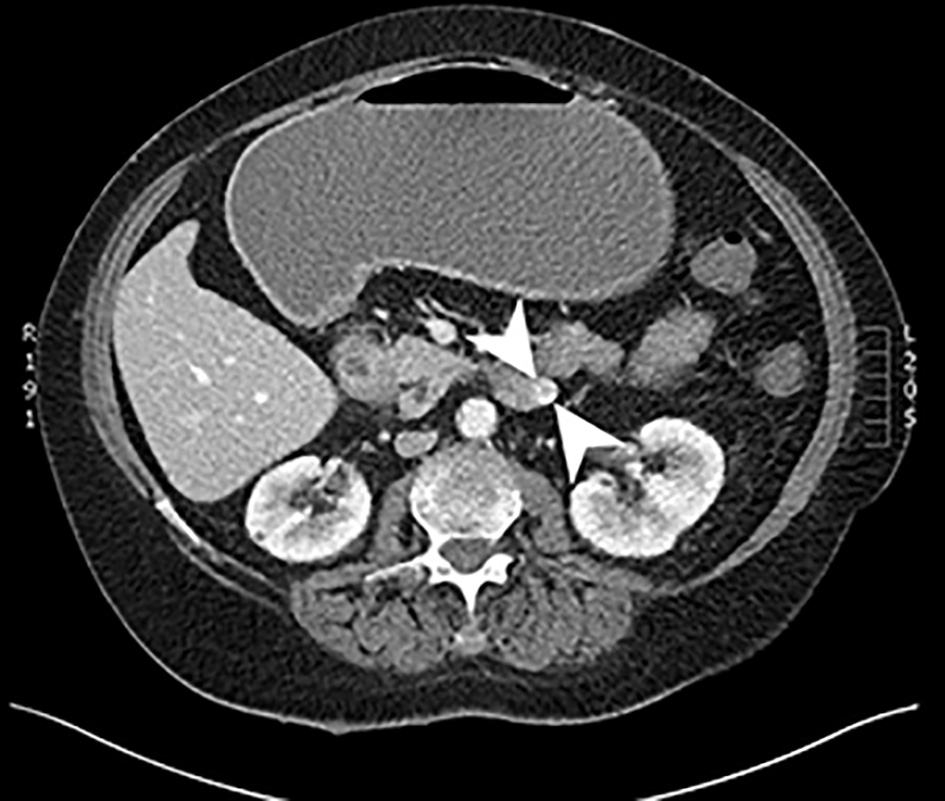
Figure 2. Computed tomography scan of the abdomen with and without contrast. An axial slice from the venous phase of a computed tomography scan showing a 2.4 × 2.2 cm heterogeneously enhancing soft tissue mass arising from the inferior aspect of the third portion of the duodenum.
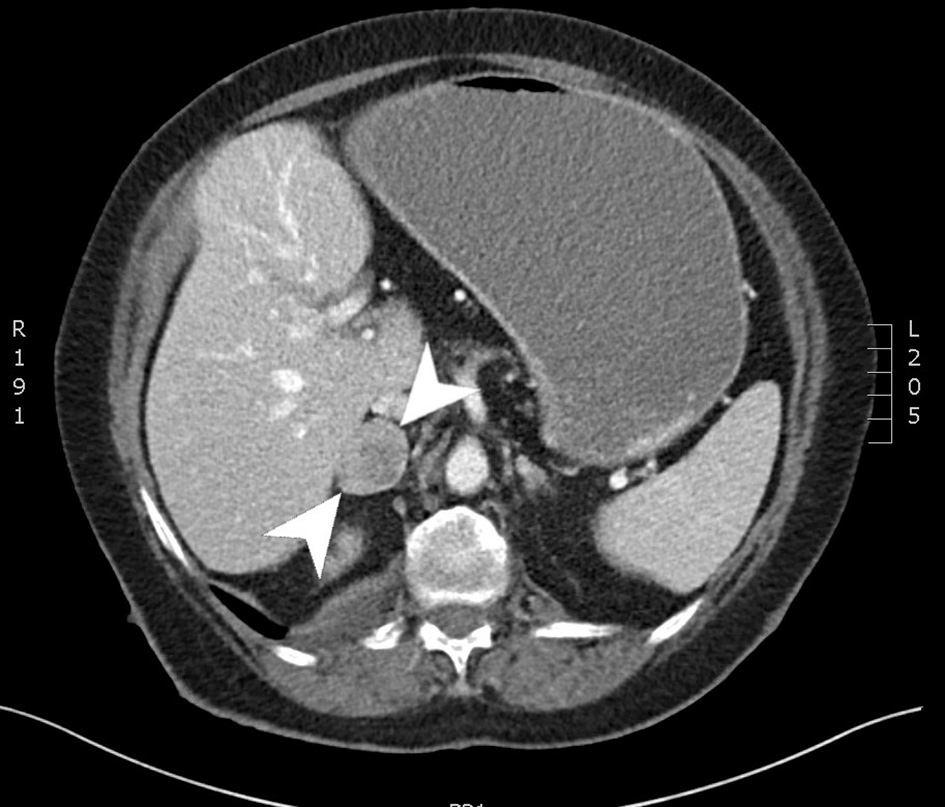
Figure 3. Computed tomography scan of the abdomen with and without contrast. An axial slice from the venous phase of a computed tomography scan showing a 3.7 × 2.8 cm right adrenal mass.
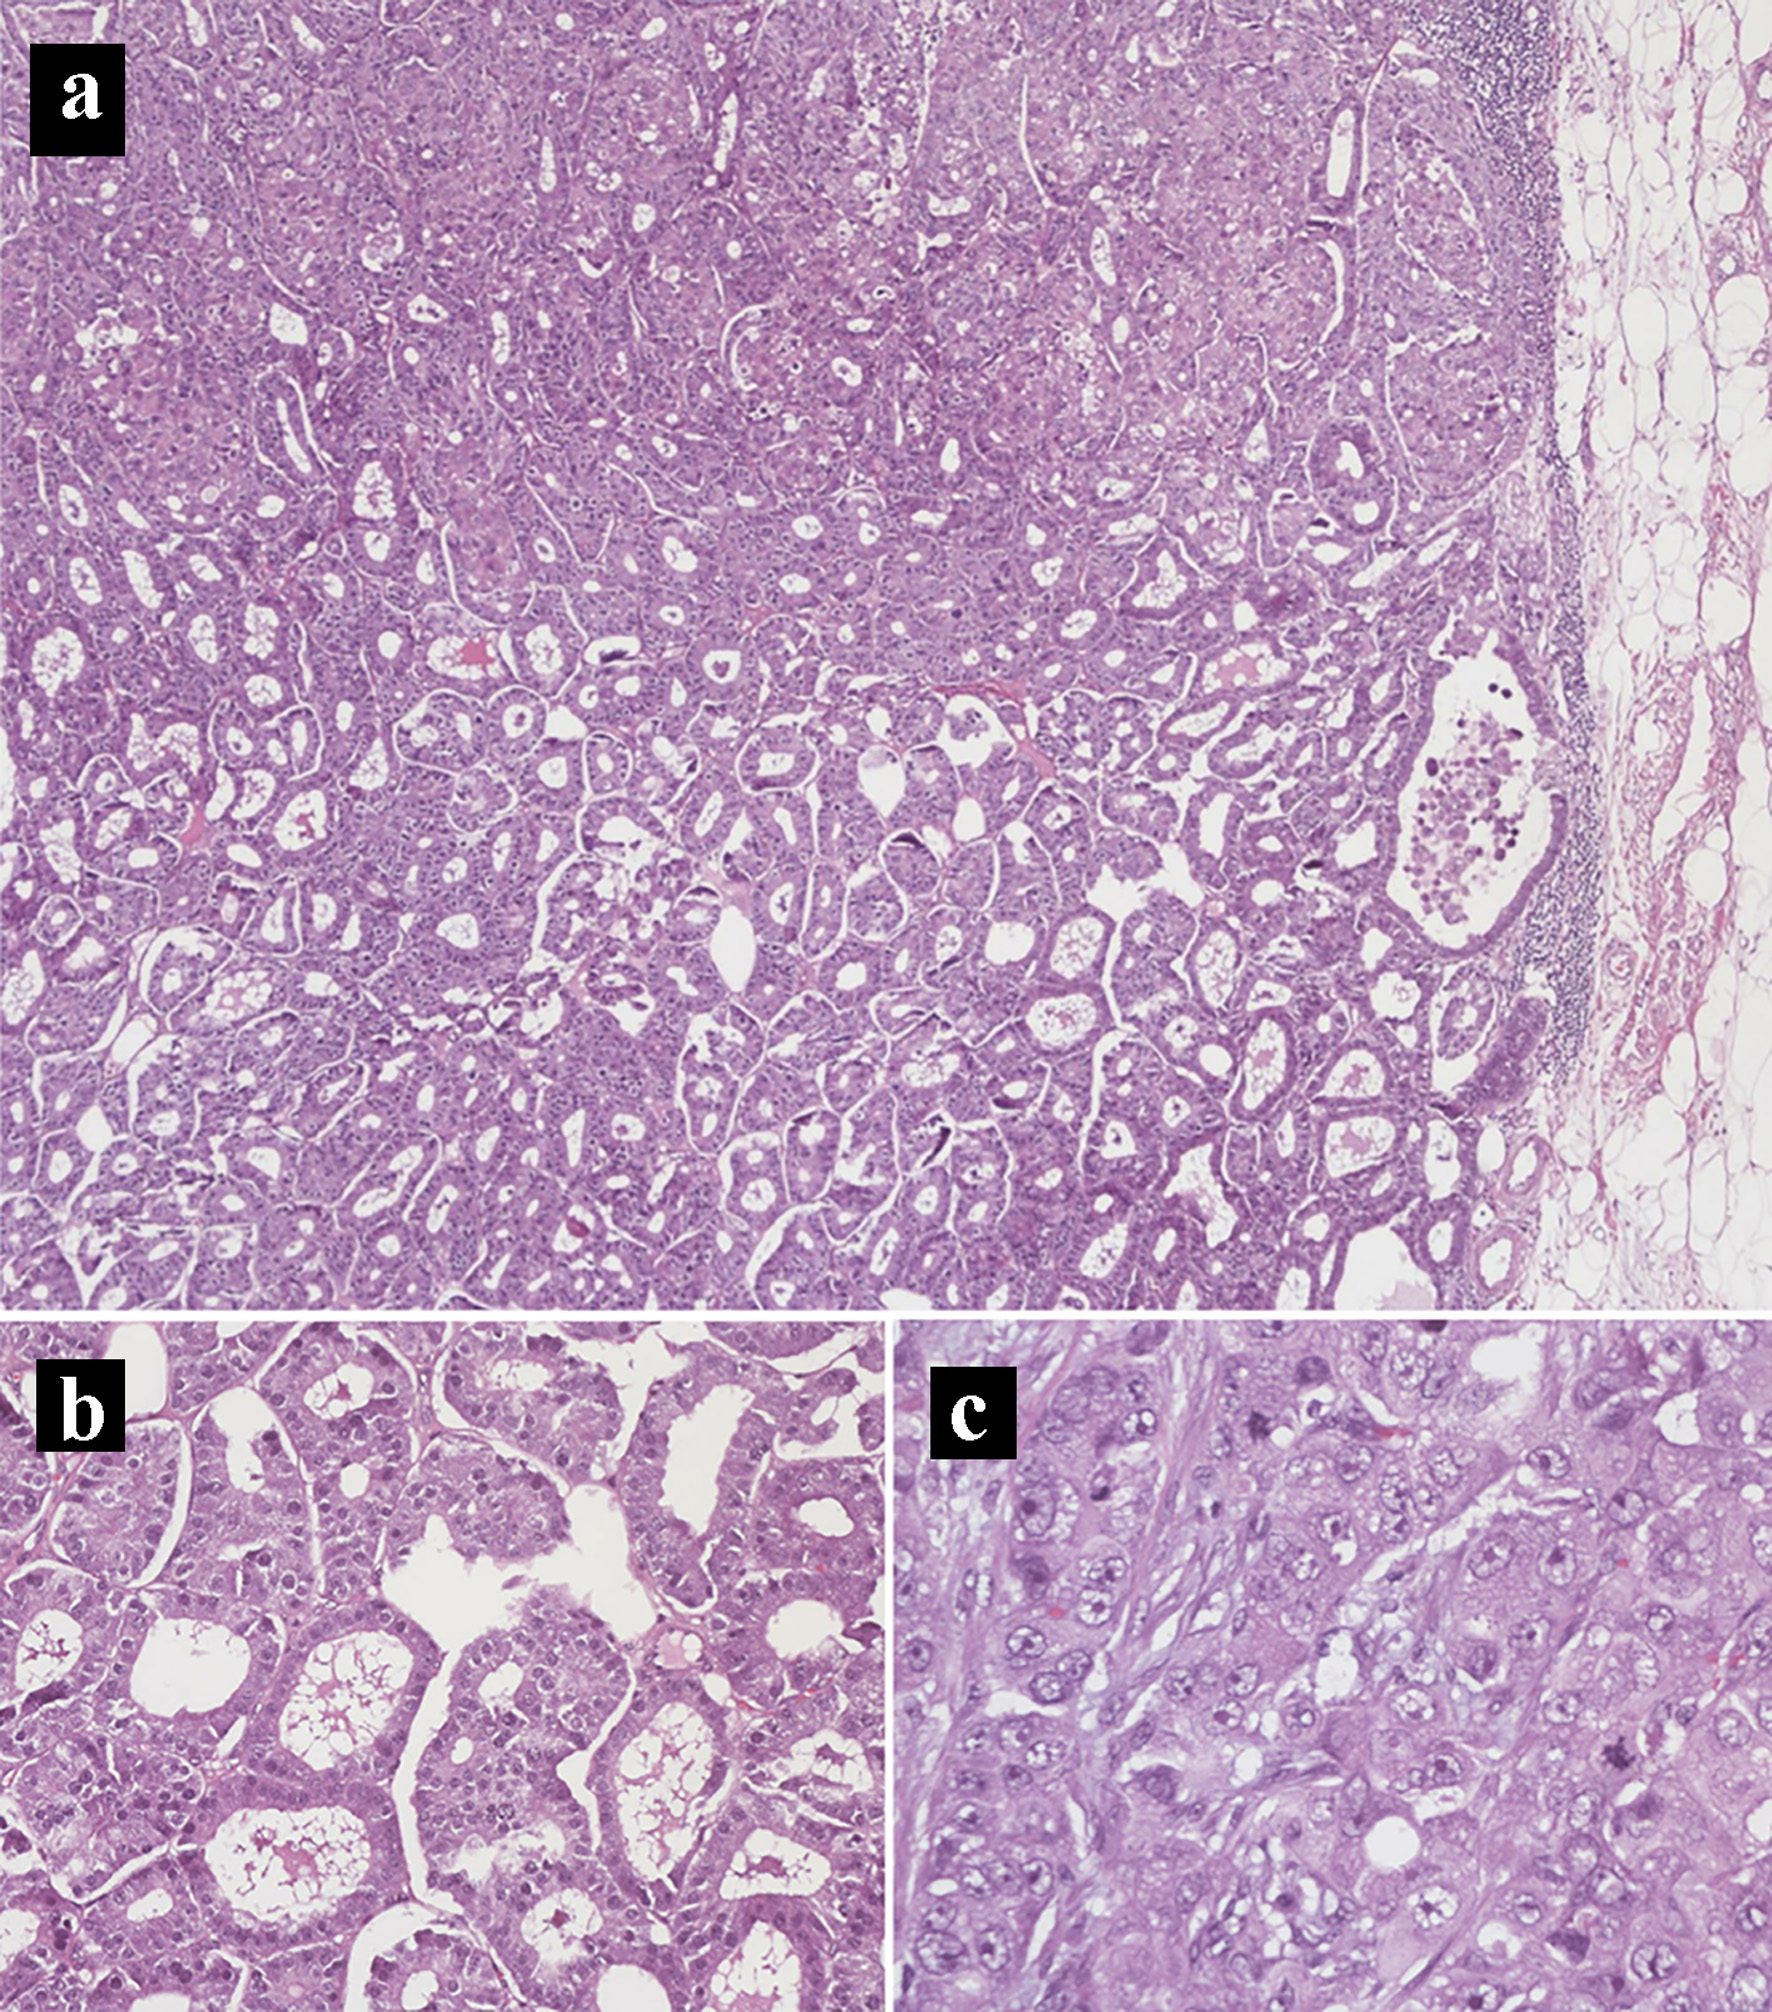
Figure 4. Hematoxylin and eosin histology slides of the primary pancreatic ductal adenocarcinoma and neuroendocrine tumors. (a) Mixed pancreatic ductal adenocarcinoma (top) and well-differentiated neuroendocrine tumor (bottom) (× 40). (b) Neuroendocrine tumor component. (c) Pancreatic ductal adenocarcinoma component in a solid pattern with high-grade nuclei, prominent nucleoli, and frequent mitoses (× 400).
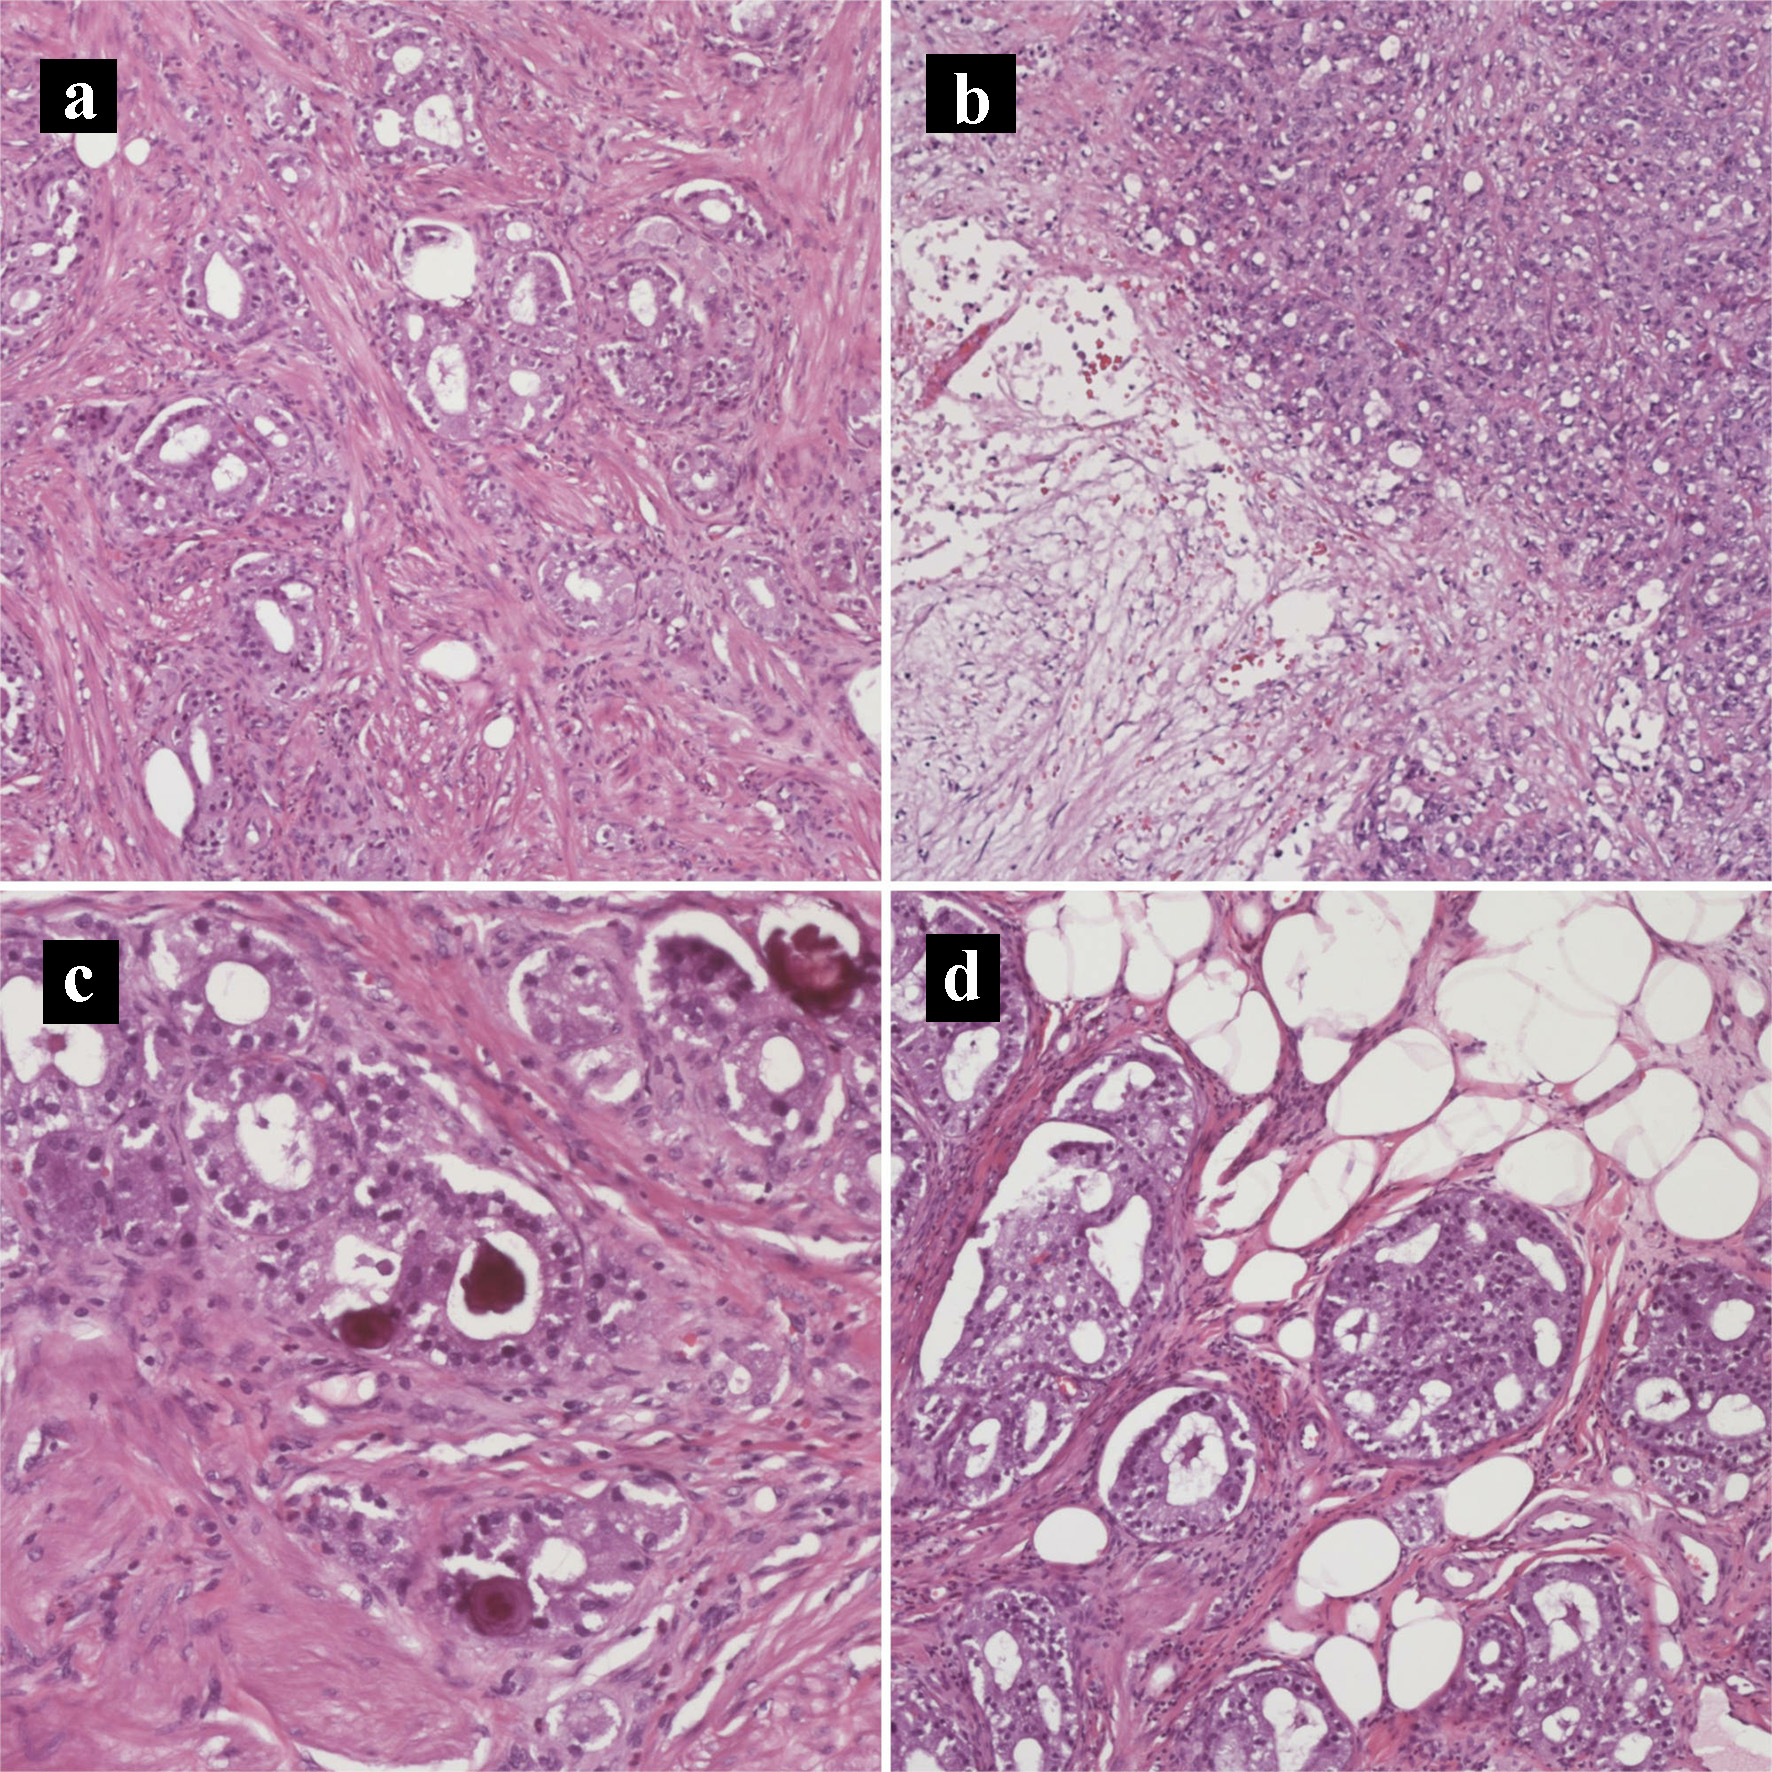
Figure 5. Hematoxylin and eosin histology slides of the primary pancreatic ductal adenocarcinoma and neuroendocrine tumors. (a) Tumor invading the duodenal muscularis propria (× 200). (b) Pancreatic ductal adenocarcinoma with necrosis (× 100). (c) Psammomatous calcifications noted focally (× 200). (d) Tumor invading duodenal fat (× 200).
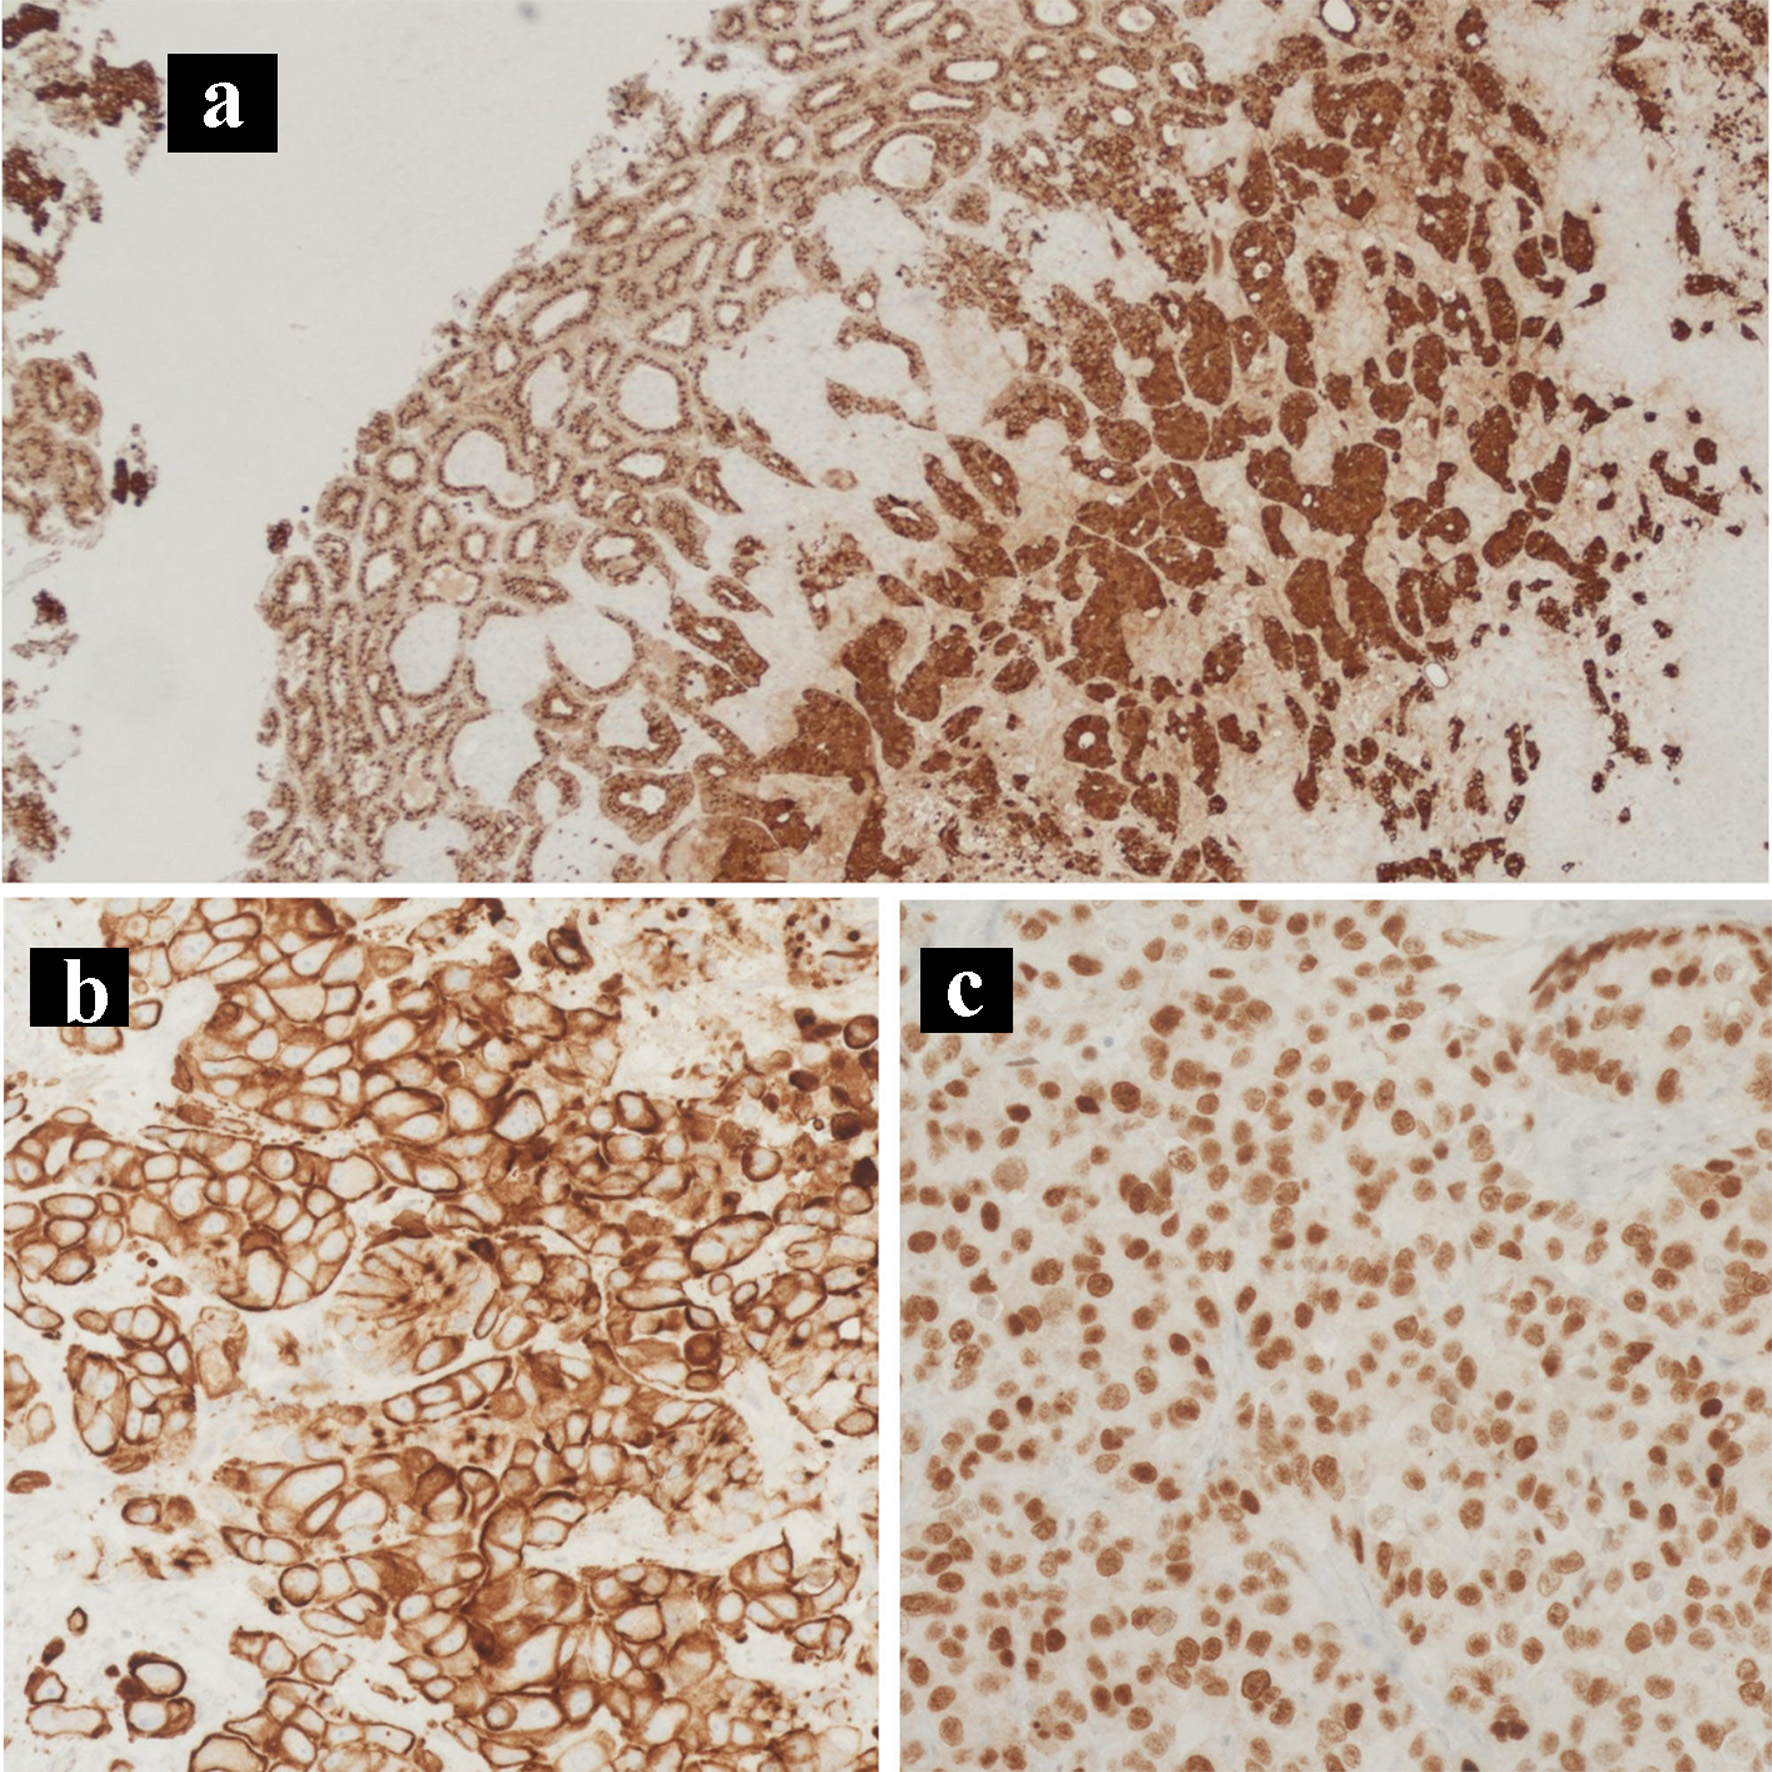
Figure 6. Immunohistochemical staining of the primary tumor. IHC stains of the primary pancreatic adenocarcinoma and neuroendocrine collision tumor. (a) Chromogranin IHC stain (× 100). (b) CK7 IHC stain (× 200). (c) CDX2 IHC stain (× 400). IHC: immunohistochemical.
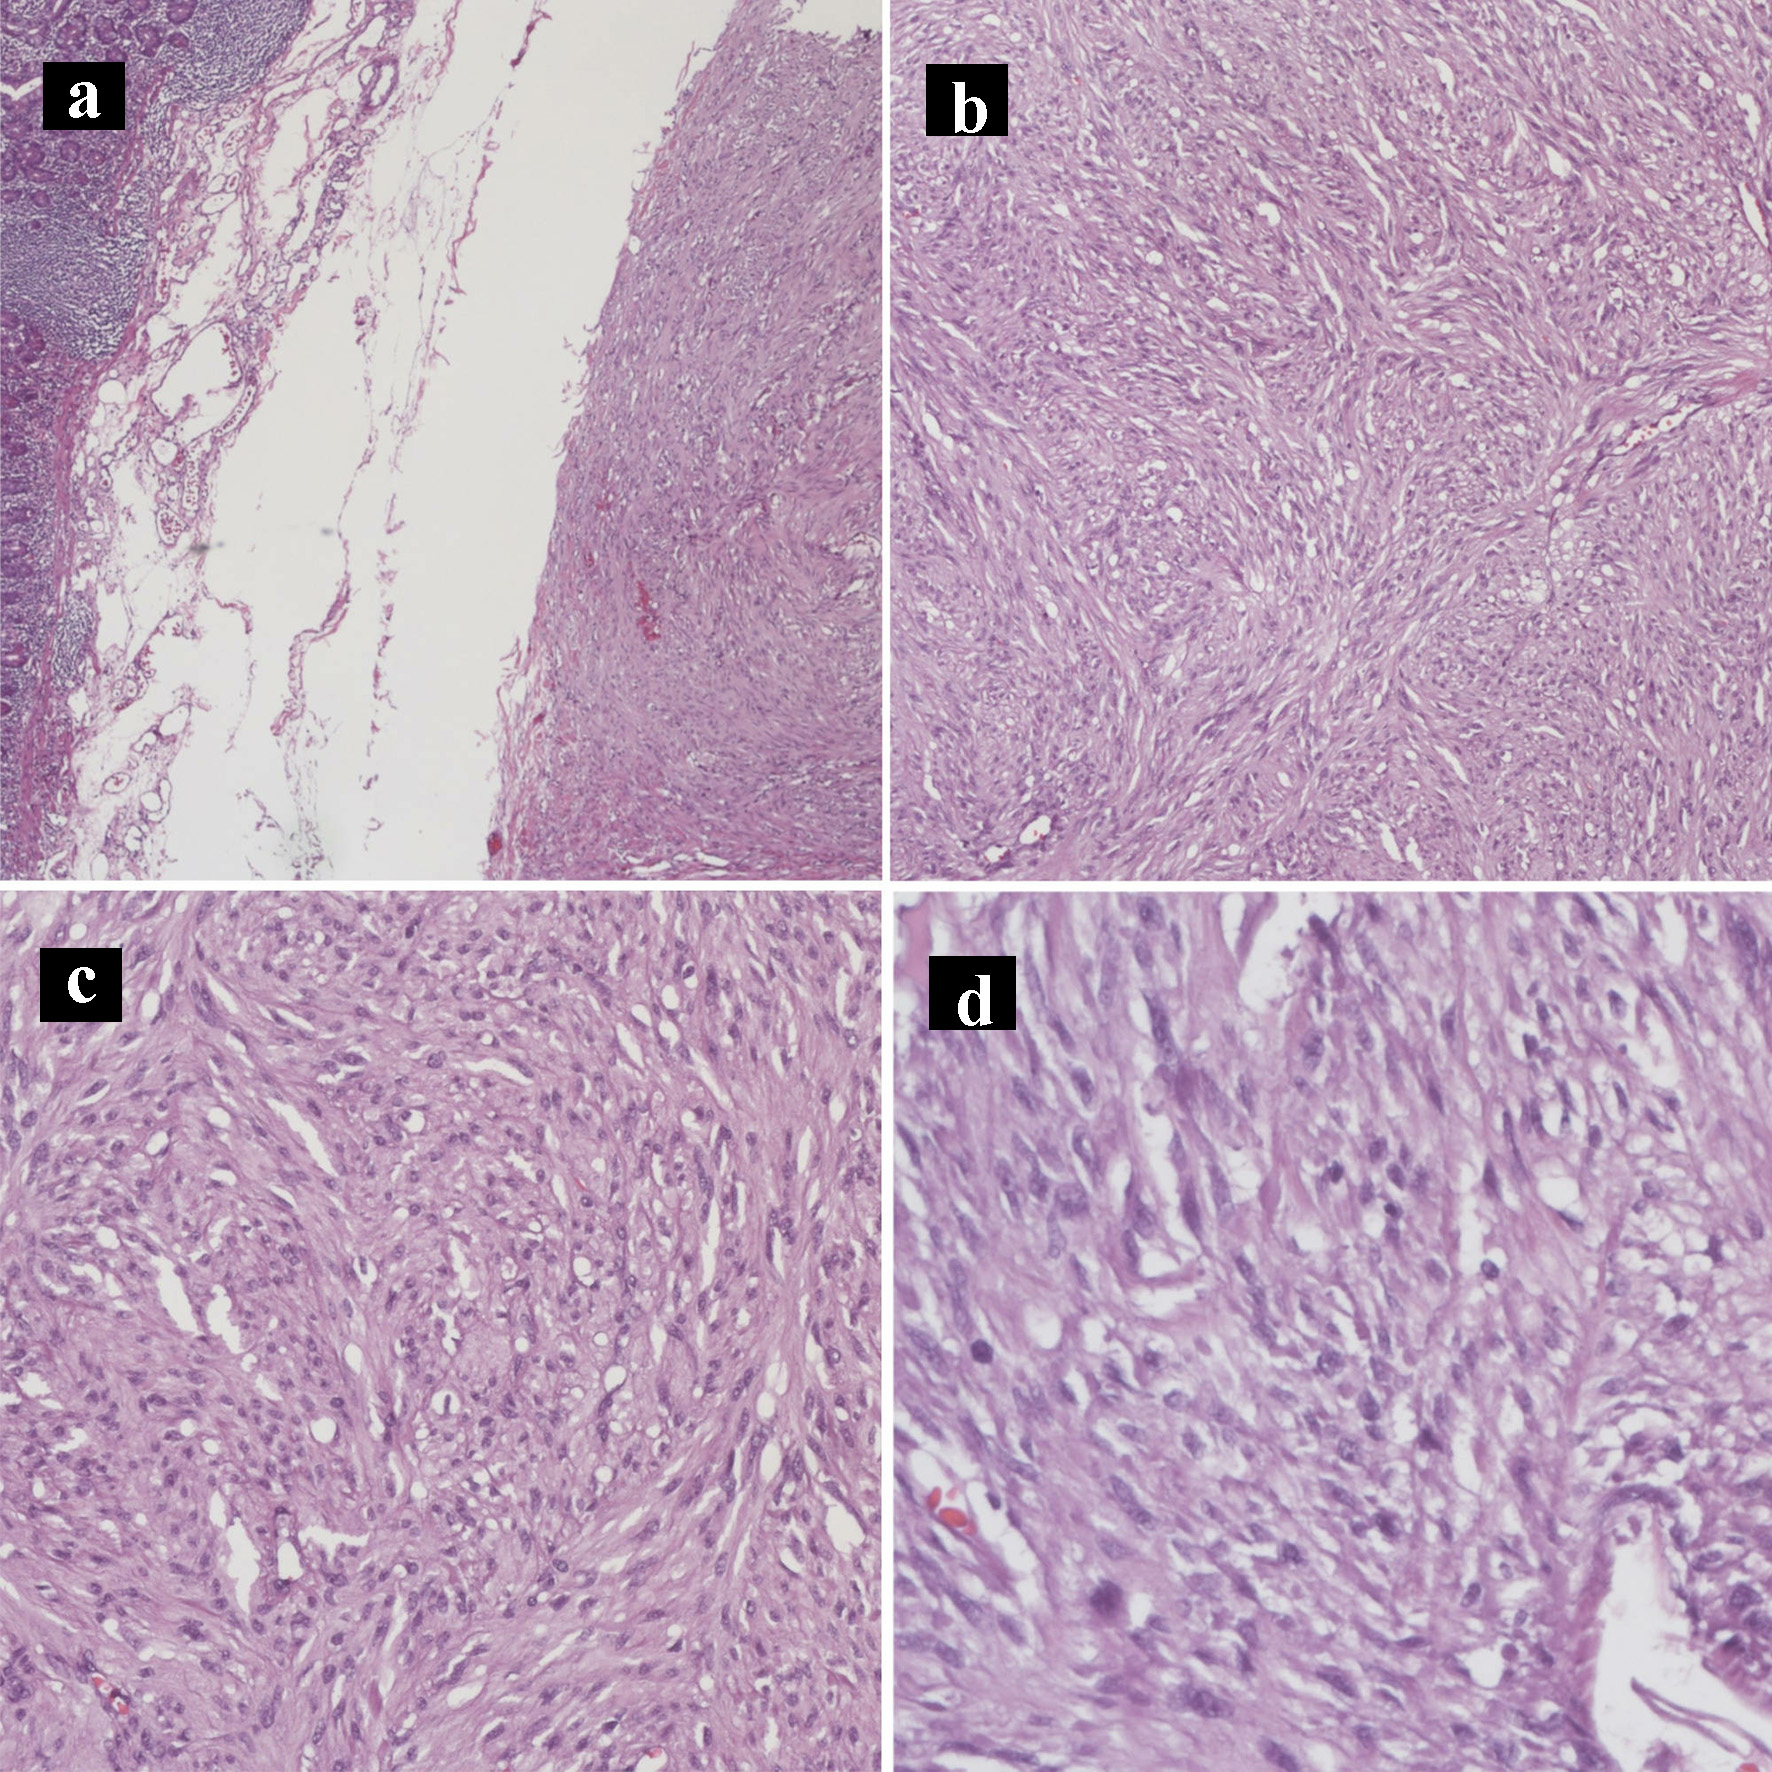
Figure 7. Hematoxylin and eosin histology slides of the gastrointestinal stromal tumor. Gastrointestinal stromal tumor characterized by bland spindle cells with faintly eosinophilic cytoplasm in a syncytial pattern and elongated nuclei with inconspicuous nucleoli (a: × 40; b: × 100; c: × 200; d: × 400).
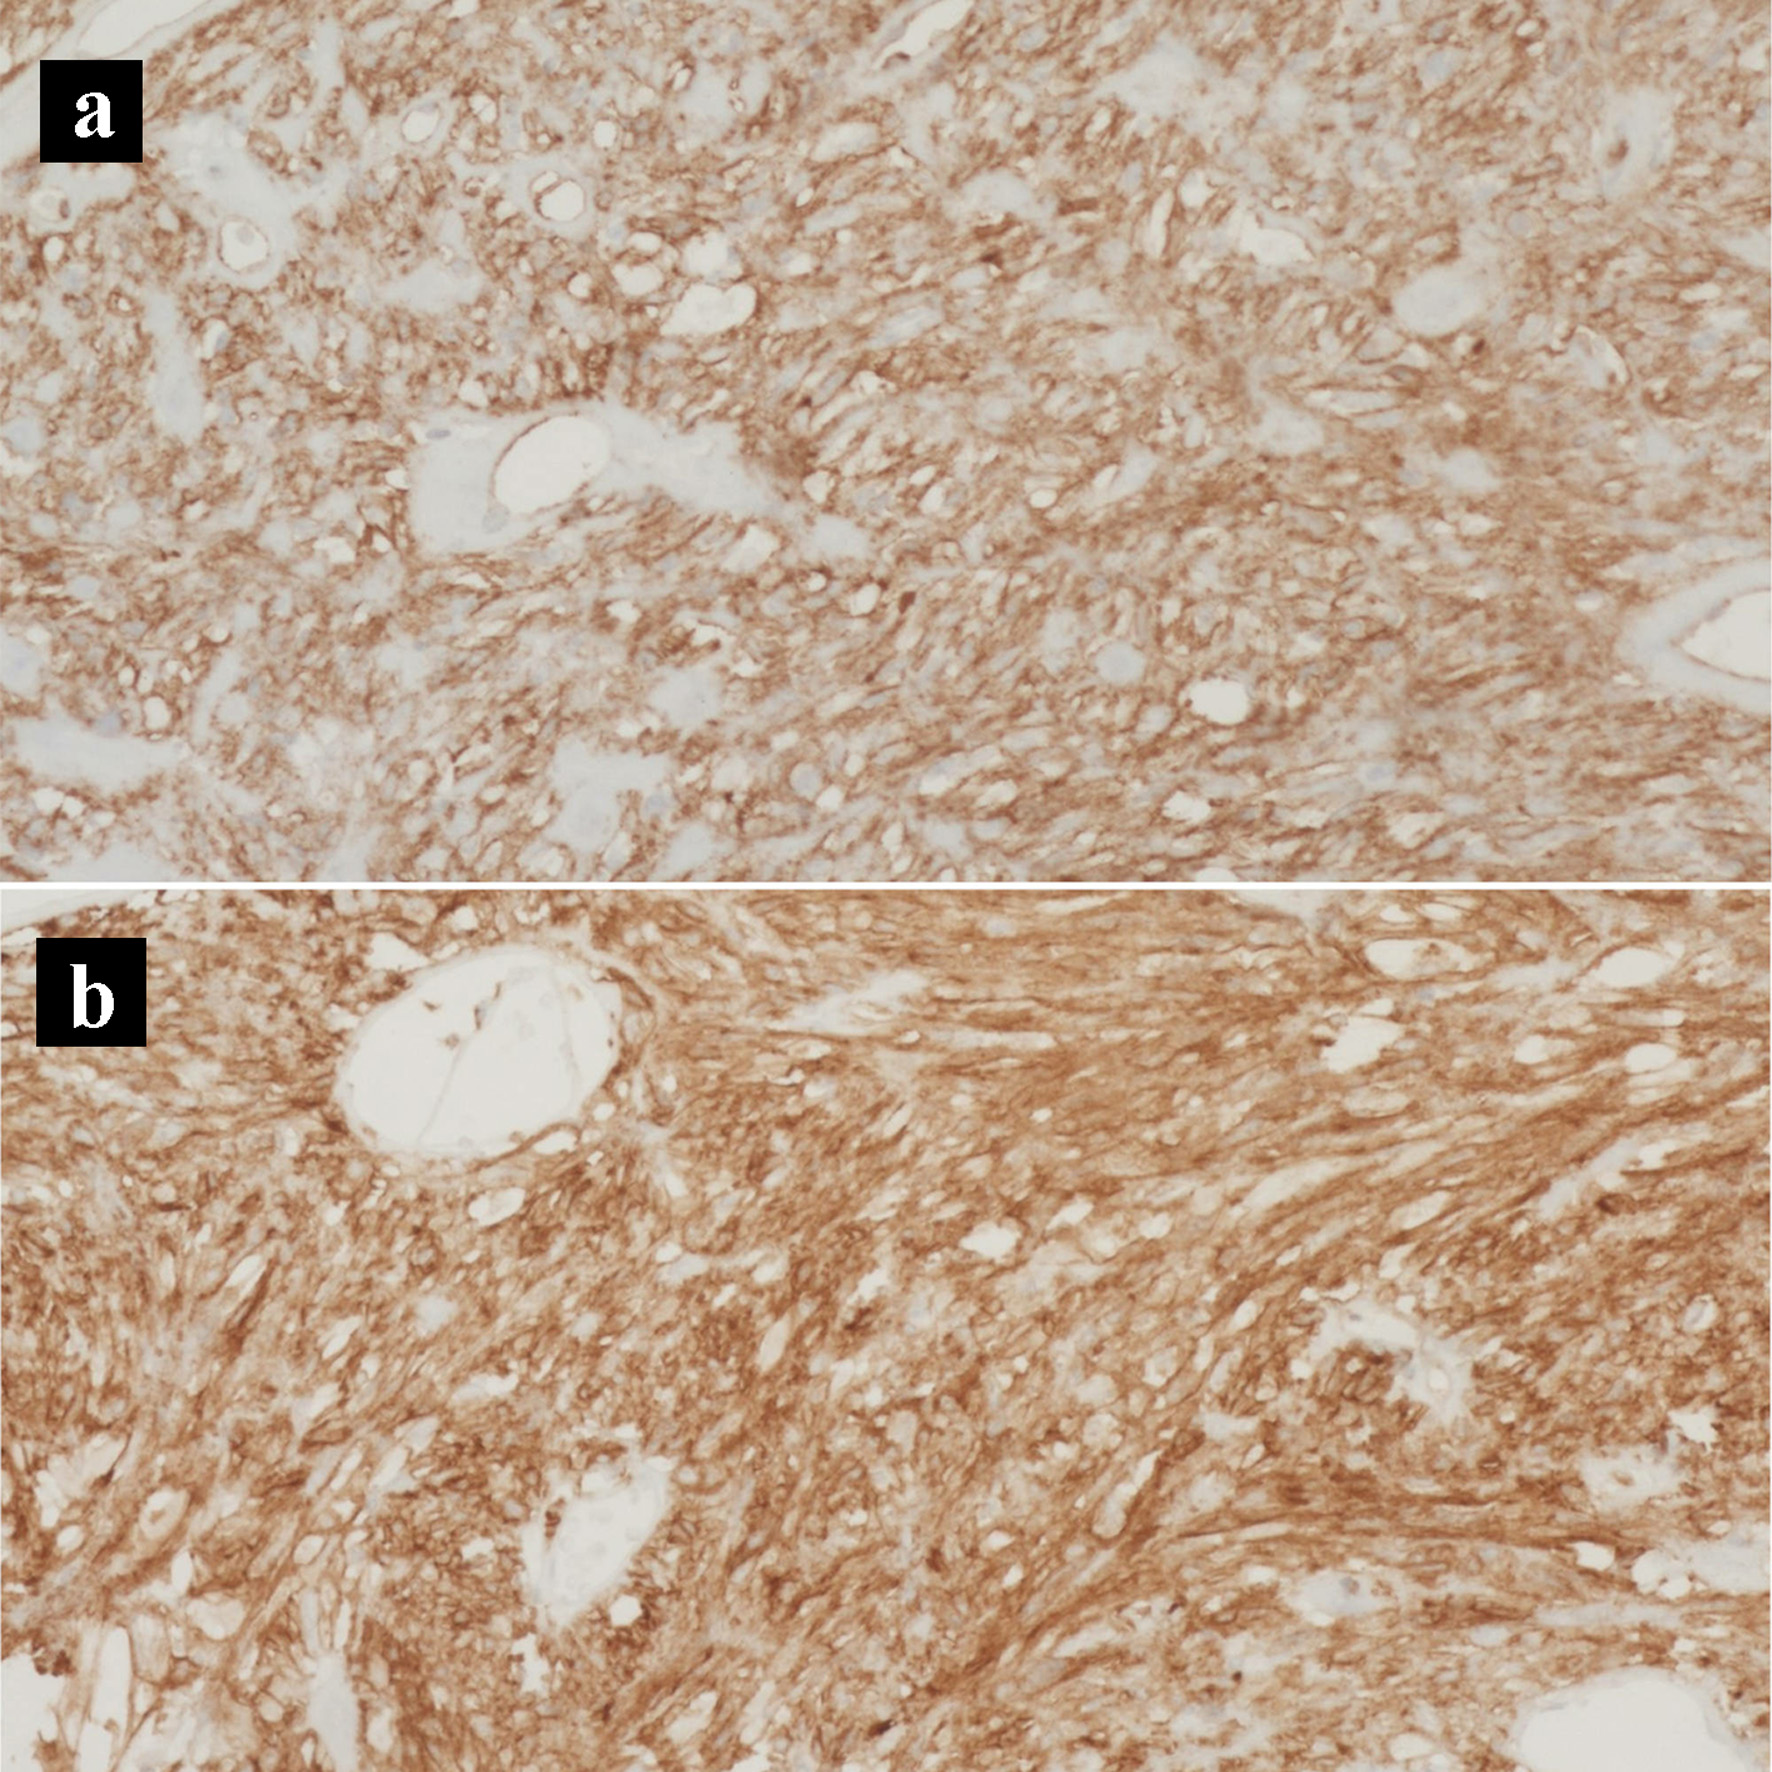
Figure 8. Immunohistochemical stains of the gastrointestinal stromal tumor. (a) CD117 IHC stain (× 200). (b) CD34 IHC stain (× 200). IHC: immunohistochemical.
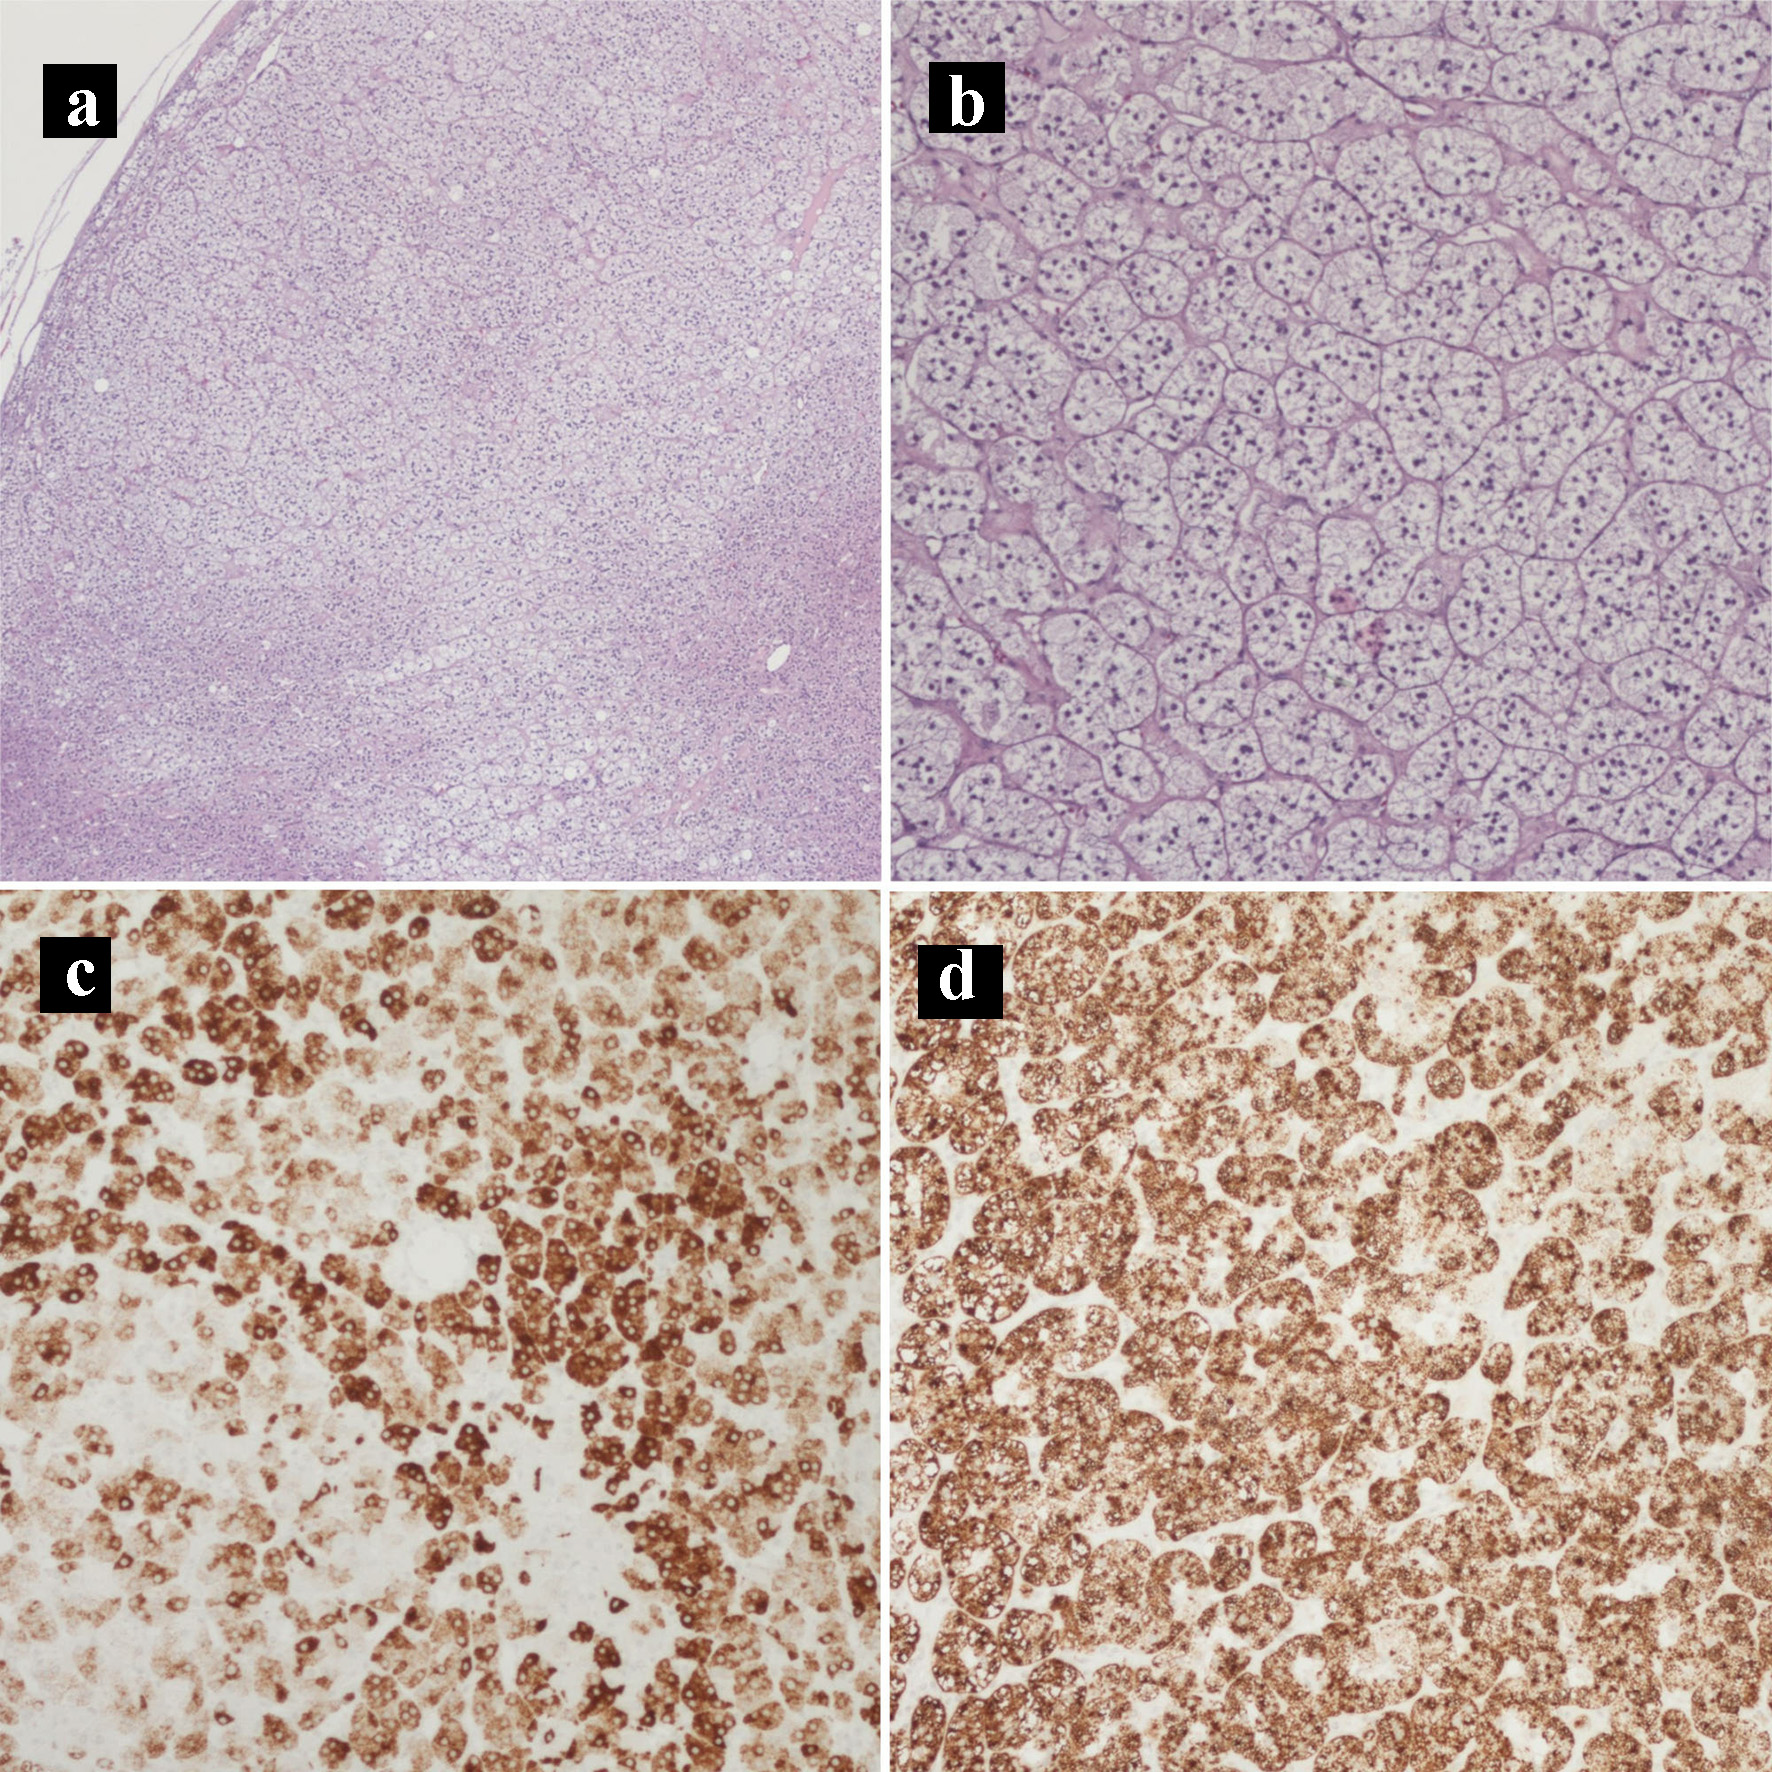
Figure 9. Hematoxylin and eosin histology slides and immunohistochemical stains of the adrenocortical adenoma. (a) Adrenocortical adenoma (× 40). (b) Adrenocortical adenoma with the characteristic clear cells with abundant and finely vacuolated cytoplasm (× 100). (c) MELAN-A IHC stain (× 100). (d) Inhibin IHC stain (× 100). IHC: immunohistochemical.
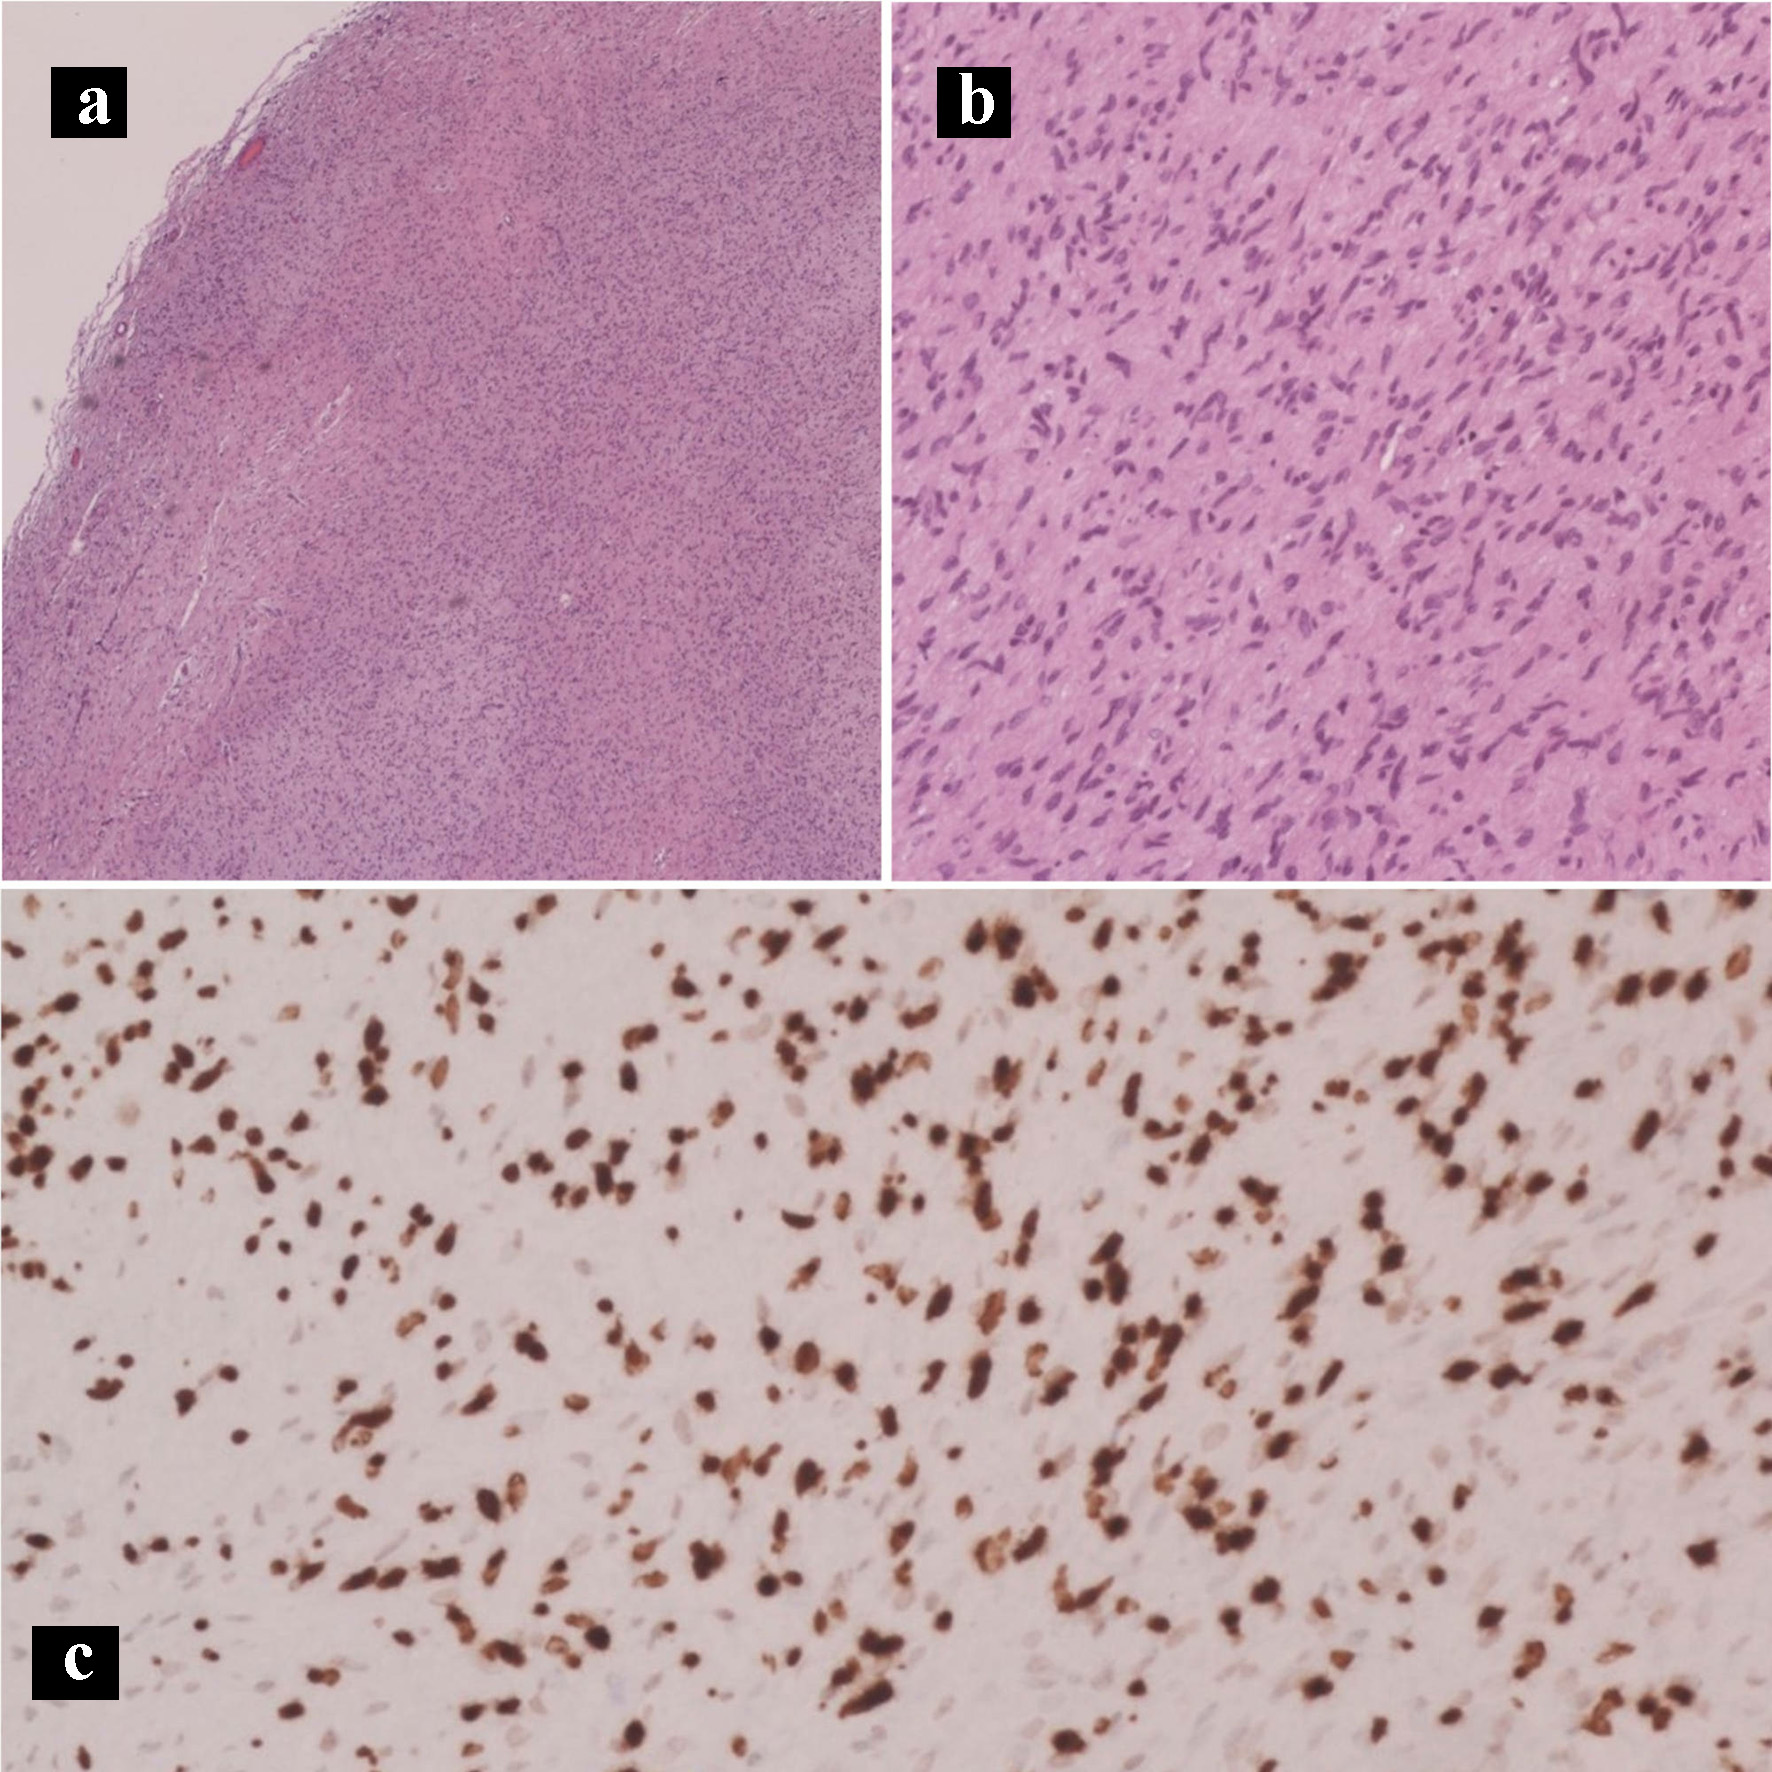
Figure 10. Hematoxylin and eosin histology slides and immunohistochemical stains of the neurofibroma. Neurofibroma characterized by Schwann cells with wire-like collagen fibrils and wavy serpentine nuclei with pointed ends (a: × 40; b: × 200). (c) SOX10 IHC stain (× 100). IHC: immunohistochemical.