Journal of Current Surgery, ISSN 1927-1298 print, 1927-1301 online, Open Access |
Article copyright, the authors; Journal compilation copyright, J Curr Surg and Elmer Press Inc |
Journal website https://www.currentsurgery.org |
Original Article
Volume 12, Number 1, March 2022, pages 7-14
Effect of Upper Limb Warming Blanket on Body Temperature Control During Total Hip Arthroplasty and Total Knee Arthroplasty
Figures
Tables
THA group (n = 105) | TKA group (n = 51) | P value | |
---|---|---|---|
Data are expressed as means ± standard deviation. Categorical variables were compared using Fisher’s exact test, and continuous variables were compared using the Mann-Whitney U test. IV-PCA: intravenous patient-controlled analgesia; ASA-PS: American Society of Anesthesiologists-Physical Status; BMI: body mass index. | |||
Types of general anesthesia | 0.321 | ||
IV-PCA | 12 ± 11.14 | 9 ± 17.16 | |
Epidural anesthesia | 93 ± 88.6 | 42 ± 82.4 | |
ASA-PS | 0.592 | ||
I | 14 (60.9) | 9 (39.1) | |
II | 83 (67.5) | 40 (32.5) | |
III | 8 (80.0) | 2 (20.0) | |
Age (years) | 64.86 ± 10.7 | 74.63 ± 6.10 | < 0.001 |
Sex, n (%) | 0.548 | ||
Woman | 82 (68.9) | 37 (31.1) | |
Man | 23 (62.2) | 14 (37.8) | |
BMI | 23.09 ± 3.64 | 25.20 ± 3.91 | 0.001 |
During admission | 30.31 ± 29.56 | 27.16 ± 11.02 | 0.462 |
Operation time | 64.97 ± 24.49 | 74.04 ± 14.93 | 0.016 |
Anesthesia time | 109.21 ± 26.78 | 116.24 ± 17.48 | 0.09 |
THA group (n=105) | TKA group (n=51) | P value | |
---|---|---|---|
Data are expressed as means ± standard deviation. Continuous variables were compared using the Mann-Whitney U test. Alb: albumin; ALP: alkaline phosphatase; ALT: alanine aminotransferase; APTT: activated partial thromboplastin time; AST: aspartate aminotransferase; BUN: blood urea nitrogen; Cl: chloride; Cre: creatinine; CRP: C-reactive protein; γ-GTP: γ-glutamyl transpeptidase; Hb: hemoglobin; HbA1c: hemoglobin A1c; HT: hematocrit; K: potassium; Na: sodium; PLT: platelet; PT: prothrombin time; PTINR: prothrombin time-international normalized ratio; PT: prothrombin time; RBC: red blood cell; TP: total protein; WBC: white blood cell. | |||
Alb (g/dL) | 4.15 ± 0.44 | 4.15 ± 0.34 | 0.961 |
ALP (U/L) | 291.04 ± 98.66 | 250.35 ± 75.27 | 0.01 |
ALT (U/L) | 19.88 ± 12.03 | 21.00 ± 9.87 | 0.564 |
APTT (s) | 29.23 ± 3.71 | 28.34 ± 4.30 | 0.185 |
AST (U/L) | 21.99 ± 6.24 | 23.94 ± 7.56 | 0.09 |
BUN (mg/dL) | 16.35 ± 5.24 | 18.13 ± 4.68 | 0.042 |
Cl (mmol/L) | 104.00 ± 3.39 | 104.47 ± 2.18 | 0.368 |
Cre (mg/dL) | 0.75 ± 0.37 | 0.81 ± 0.26 | 0.303 |
CRP (mg/dL) | 0.75 ± 1.57 | 0.65 ± 2.29 | 0.752 |
γ-GTP (U/L) | 38.57 ± 50.10 | 40.33 ± 59.11 | 0.846 |
Hb (g/dL) | 13.07 ± 1.63 | 13.58 ± 1.84 | 0.08 |
HbA1c (%) | 5.75 ± 0.58 | 6.02 ± 0.64 | 0.01 |
HT (%) | 38.70 ± 4.38 | 40.05 ± 4.89 | 0.085 |
K (mmol/L) | 4.08 ± 0.40 | 4.18 ± 0.33 | 0.117 |
Na (mmol/L) | 140.86 ± 2.95 | 140.90 ± 2.15 | 0.923 |
PLT (× 104/µL) | 24.58 ± 7.03 | 21.47 ± 5.89 | 0.007 |
PT (%) | 103.87 ± 14.53 | 102.54 ± 12.54 | 0.577 |
PTINR (s) | 0.99(± 0.17) | 0.99 ± 0.10 | 0.952 |
PT (s) | 11.41(± 1.88) | 11.36 ± 1.16 | 0.868 |
RBC (× 104/µL) | 420.77 ± 52.64 | 435.71 ± 56.77 | 0.107 |
TP (g/dL) | 7.12 ± 0.59 | 7.17 ± 0.43 | 0.525 |
WBC (× 103/µL) | 69.78 ± 24.91 | 61.10 ± 14.71 | 0.023 |
THA group (n = 105) | TKA group (n = 51) | P value | |
---|---|---|---|
Data are expressed as means ± standard deviation. Continuous variables were compared using the Mann-Whitney U test. THA: total hip arthroplasty; TKA: total knee arthroplasty. | |||
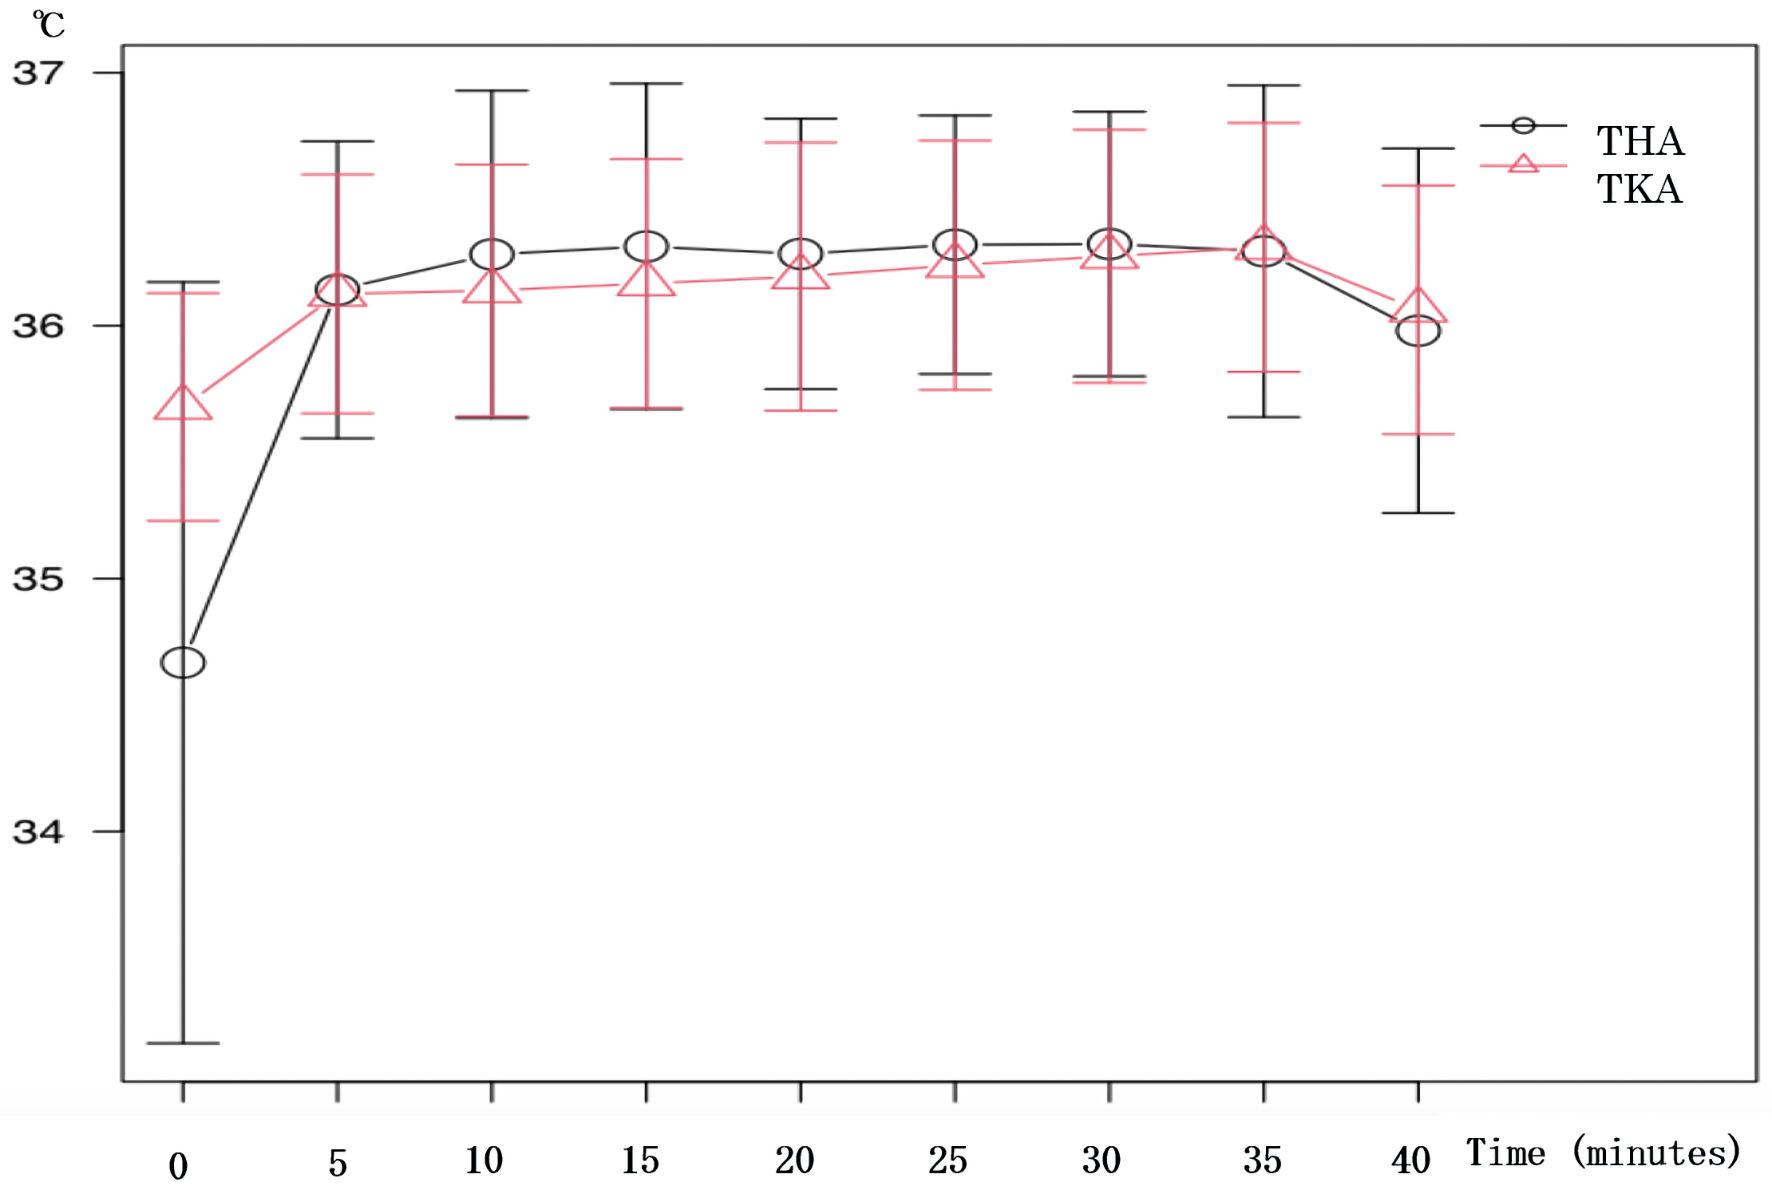
Start | 34.67 ± 1.50 | 35.68 ± 0.45 | 0.001 |
After 5 points | 35.98 ± 0.72 | 36.06 ± 0.49 | 0.46 |
10 min later | 36.14 ± 0.59 | 36.13 ± 0.47 | 0.862 |
15 min later | 36.28 ± 0.65 | 36.14 ± 0.50 | 0.167 |
20 min later | 36.31 ± 0.64 | 36.17 ± 0.49 | 0.153 |
25 min later | 36.28 ± 0.53 | 36.19 ± 0.53 | 0.326 |
30 min later | 36.32 ± 0.51 | 36.24 ± 0.49 | 0.35 |
After 35 min | 36.32 ± 0.52 | 36.27 ± 0.50 | 0.584 |
After 40 min | 36.29 ± 0.66 | 36.31 ± 0.49 | 0.881 |